1
2
3
4
5
6
7
8
9
10
11
12
13
14
15
16
17
18
19
20
21
22
23
24
25
26
27
28
29
30
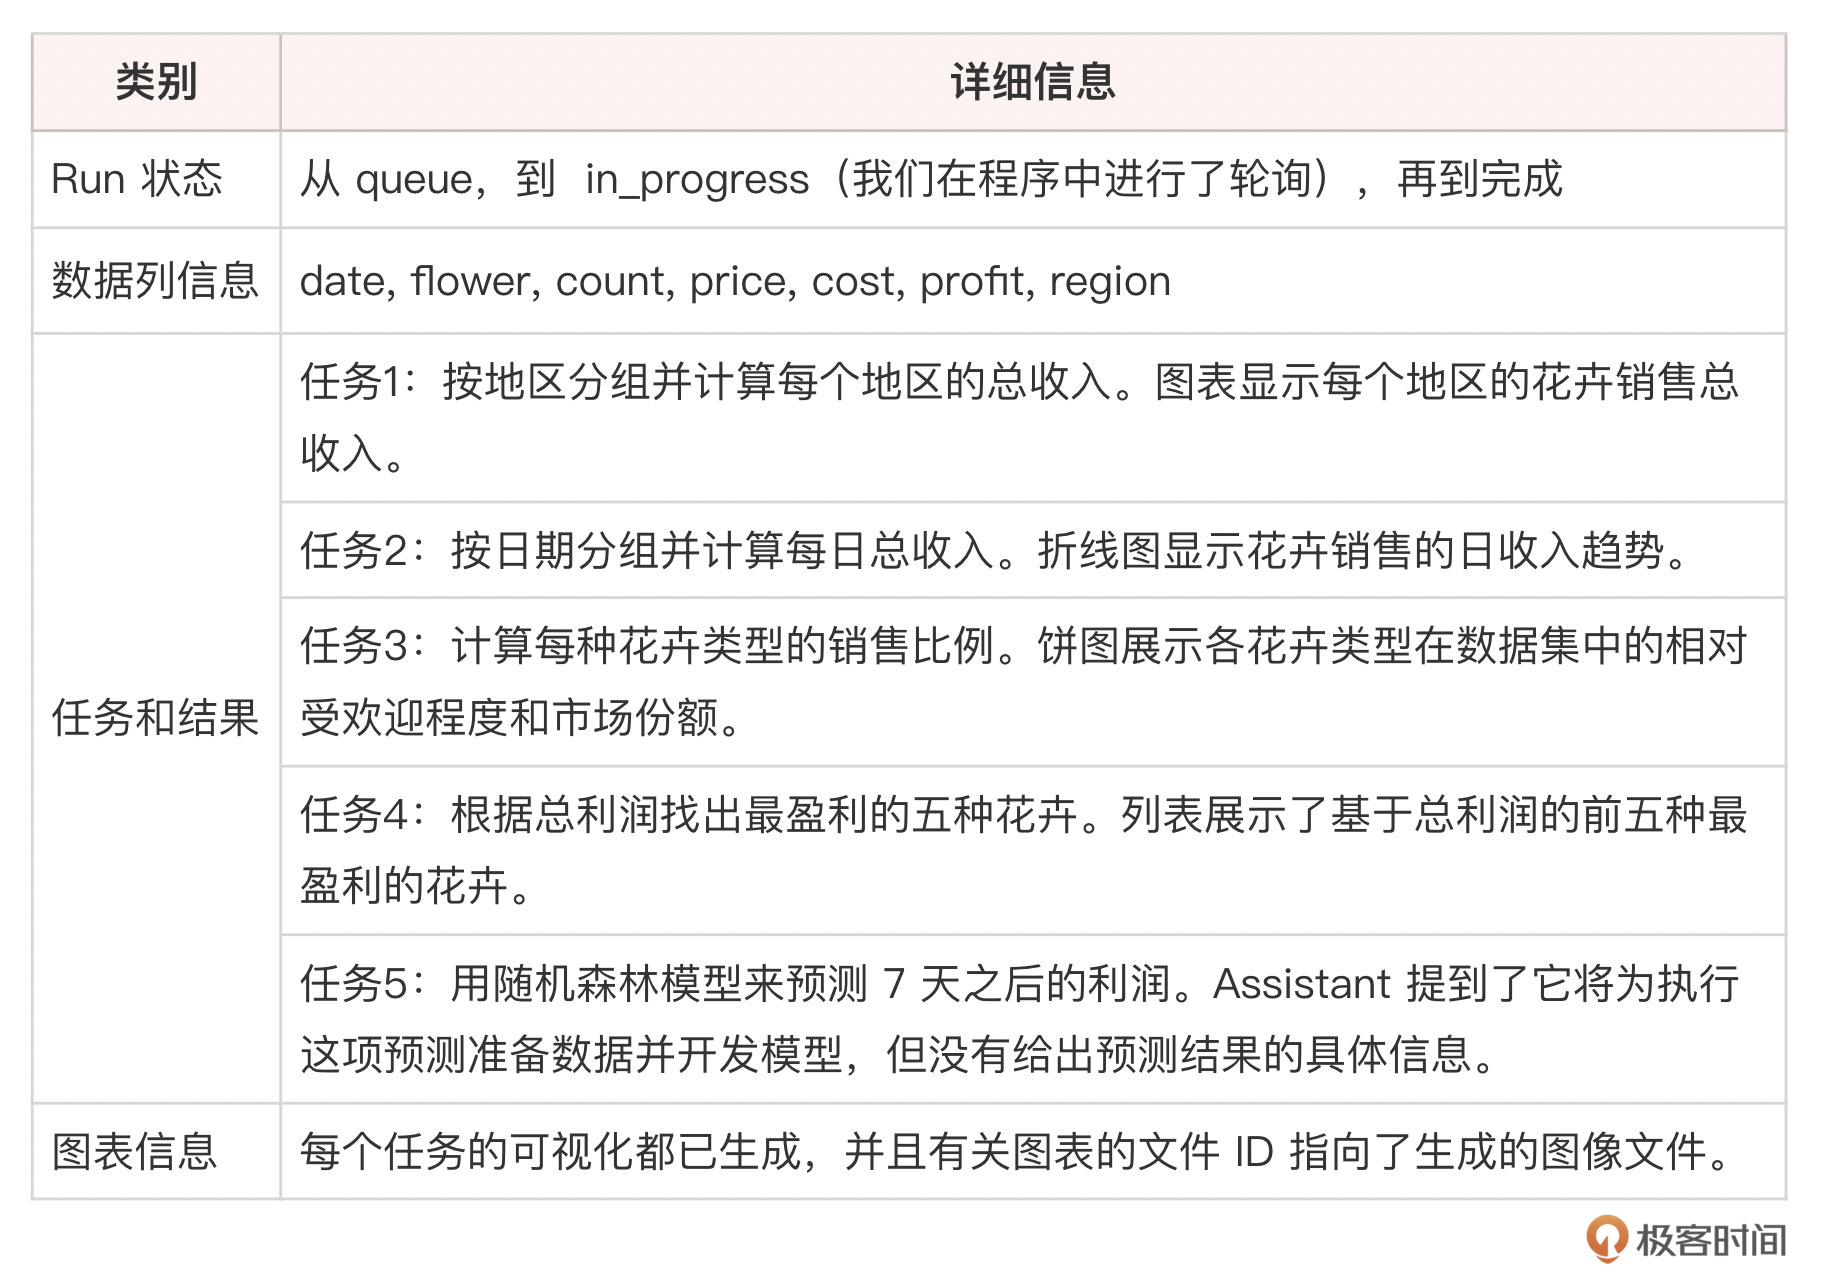
| Run的初始信息: queued
Run的轮询信息:
Run(id='run_202iwnMlW8nJVbEKOMPWJqVT', assistant_id='asst_ZzFnvavBoYZ59NDLnLinNC99', cancelled_at=None, completed_at=None, created_at=1713842398, expires_at=1713842998, failed_at=None, incomplete_details=None, instructions='\n Please use the flower_sales.csv data to complete the following analysis tasks:\n # 1. Group the data by region and calculate the total revenue for each region. Visualize the results using a bar chart.\n # 2. Group the data by date and calculate the daily total revenue. Create a line chart to show the revenue trend over time.\n 3. Calculate the sales proportion of each flower type and display the results in a pie chart.\n 4. Find the top 5 most profitable flowers based on the total profit.\n # 5. Using the historical sales data, forecast the total revenue for the next 7 days using a Random Forest Regressor model.\n ', last_error=None, max_completion_tokens=None, max_prompt_tokens=None, metadata={}, model='gpt-4-turbo', object='thread.run', required_action=None, response_format='auto', started_at=1713842398, status='in_progress', thread_id='thread_D3JUkq05bfvtmBw7QoNSuTy7', tool_choice='auto', tools=[CodeInterpreterTool(type='code_interpreter')], truncation_strategy=TruncationStrategy(type='auto', last_messages=None), usage=None, temperature=1.0, top_p=1.0, tool_resources={})
Run的轮询信息:
Run(id='run_202iwnMlW8nJVbEKOMPWJqVT', assistant_id='asst_ZzFnvavBoYZ59NDLnLinNC99', cancelled_at=None, completed_at=1713842464, created_at=1713842398, expires_at=None, failed_at=None, incomplete_details=None, instructions='\n Please use the flower_sales.csv data to complete the following analysis tasks:\n # 1. Group the data by region and calculate the total revenue for each region. Visualize the results using a bar chart.\n # 2. Group the data by date and calculate the daily total revenue. Create a line chart to show the revenue trend over time.\n 3. Calculate the sales proportion of each flower type and display the results in a pie chart.\n 4. Find the top 5 most profitable flowers based on the total profit.\n # 5. Using the historical sales data, forecast the total revenue for the next 7 days using a Random Forest Regressor model.\n ', last_error=None, max_completion_tokens=None, max_prompt_tokens=None, metadata={}, model='gpt-4-turbo', object='thread.run', required_action=None, response_format='auto', started_at=1713842398, status='completed', thread_id='thread_D3JUkq05bfvtmBw7QoNSuTy7', tool_choice='auto', tools=[CodeInterpreterTool(type='code_interpreter')], truncation_strategy=TruncationStrategy(type='auto', last_messages=None), usage=Usage(completion_tokens=1001, prompt_tokens=11781, total_tokens=12782), temperature=1.0, top_p=1.0, tool_resources={})
全部的message SyncCursorPage[Message](data=[Message(id='msg_cRSYdkrscxnyHXimfqqivQZn', assistant_id='asst_ZzFnvavBoYZ59NDLnLinNC99', attachments=[], completed_at=None, content=[TextContentBlock(text=Text(annotations=[], value="The top 5 most profitable flowers based on the total profit are listed below:\n1. **Rose** with a profit of \\$30,532.50\n2. **Tulip** with a profit of \\$25,037.00\n3. **Lily** with a profit of \\$15,823.00\n4. **Daisy** with a profit of \\$9,905.00\n5. **Sunflower** with a profit of \\$9,517.00\n\nThese results reveal which flower types are contributing most significantly to the business's bottom line. \n\nLet's move forward with the final task which involves forecasting the total revenue for the next 7 days using a Random Forest Regressor model. I will prepare the data and develop the model to perform this forecast."), type='text')], created_at=1713842457, incomplete_at=None, incomplete_details=None, metadata={}, object='thread.message', role='assistant', run_id='run_202iwnMlW8nJVbEKOMPWJqVT', status=None, thread_id='thread_D3JUkq05bfvtmBw7QoNSuTy7'), Message(id='msg_QZMADy6BrFb6LTGS0Ho7ruEi', assistant_id='asst_ZzFnvavBoYZ59NDLnLinNC99', attachments=[], completed_at=None, content=[ImageFileContentBlock(image_file=ImageFile(file_id='file-aUTB6yfVsc7AoI0SNfQteuwq'), type='image_file'), TextContentBlock(text=Text(annotations=[], value="The pie chart above presents the proportion of sales for each type of flower, indicating the relative popularity and market share of each flower type within the dataset.\n\nNext, we will proceed with task #4: identifying the top 5 most profitable flowers based on the total profit. I'll sum the profit for each flower type and display the top 5."), type='text')], created_at=1713842450, incomplete_at=None, incomplete_details=None, metadata={}, object='thread.message', role='assistant', run_id='run_202iwnMlW8nJVbEKOMPWJqVT', status=None, thread_id='thread_D3JUkq05bfvtmBw7QoNSuTy7'), Message(id='msg_r0ETiNGjOEaqFuEvw45auB52', assistant_id='asst_ZzFnvavBoYZ59NDLnLinNC99', attachments=[], completed_at=None, content=[ImageFileContentBlock(image_file=ImageFile(file_id='file-ARR9oWz1AdYwLCVeaDNsYfGk'), type='image_file'), TextContentBlock(text=Text(annotations=[], value='The line chart illustrates the daily total revenue from flower sales, showing various trends and fluctuations over time.\n\nMoving on to task #3, I will calculate the sales proportion of each flower type and visualize it using a pie chart.'), type='text')], created_at=1713842442, incomplete_at=None, incomplete_details=None, metadata={}, object='thread.message', role='assistant', run_id='run_202iwnMlW8nJVbEKOMPWJqVT', status=None, thread_id='thread_D3JUkq05bfvtmBw7QoNSuTy7'), Message(id='msg_pfR9okmWbQZTlX5FSpFwKji2', assistant_id='asst_ZzFnvavBoYZ59NDLnLinNC99', attachments=[], completed_at=None, content=[ImageFileContentBlock(image_file=ImageFile(file_id='file-DA3uSxFhVE8KqZFrWKY2YWTX'), type='image_file'), TextContentBlock(text=Text(annotations=[], value="The bar chart above displays the total revenue from flower sales for each region.\n\nNext, let's address task #2 by grouping the data by date and calculating the daily total revenue, which we will then visualize as a line chart to observe trends over time."), type='text')], created_at=1713842433, incomplete_at=None, incomplete_details=None, metadata={}, object='thread.message', role='assistant', run_id='run_202iwnMlW8nJVbEKOMPWJqVT', status=None, thread_id='thread_D3JUkq05bfvtmBw7QoNSuTy7'), Message(id='msg_SCX0Z8qv2VGtFHBGPJkp66E1', assistant_id='asst_ZzFnvavBoYZ59NDLnLinNC99', attachments=[], completed_at=None, content=[TextContentBlock(text=Text(annotations=[], value="The dataset contains the following columns:\n- `date`: The date of sales\n- `flower`: Type of flower sold\n- `count`: The number of flowers sold\n- `price`: Total price received for the flowers sold\n- `cost`: Total cost of the flowers sold\n- `profit`: Total profit from the flower sales\n- `region`: Geographic region of the sales\n\nFrom your requests, we'll proceed with the analysis tasks:\n1. Group the data by region and calculate the total revenue for each region.\n2. Group the data by date and calculate the daily total revenue.\n3. Calculate the sales proportion of each flower type.\n4. Find the top 5 most profitable flowers based on the total profit.\n\nLet's start with task #1 and visualize the total revenue for each region."), type='text')], created_at=1713842408, incomplete_at=None, incomplete_details=None, metadata={}, object='thread.message', role='assistant', run_id='run_202iwnMlW8nJVbEKOMPWJqVT', status=None, thread_id='thread_D3JUkq05bfvtmBw7QoNSuTy7'), Message(id='msg_0wyxD0pWM9DbMOevRVuuwPZW', assistant_id='asst_ZzFnvavBoYZ59NDLnLinNC99', attachments=[], completed_at=None, content=[TextContentBlock(text=Text(annotations=[], value="Let's start by examining the contents of the uploaded CSV file to understand its structure and data types. I will then proceed with the specified data analysis tasks."), type='text')], created_at=1713842399, incomplete_at=None, incomplete_details=None, metadata={}, object='thread.message', role='assistant', run_id='run_202iwnMlW8nJVbEKOMPWJqVT', status=None, thread_id='thread_D3JUkq05bfvtmBw7QoNSuTy7'), Message(id='msg_SujuDWSAVzkKVx45SrhVnQQL', assistant_id=None, attachments=[Attachment(add_to=None, file_id='file-XXkzo0wHANWlrkMd1ZnaESor', tools=[{'type': 'code_interpreter'}])], completed_at=None, content=[TextContentBlock(text=Text(annotations=[], value='Please perform the data analysis tasks as instructed.'), type='text')], created_at=1713842397, incomplete_at=None, incomplete_details=None, metadata={}, object='thread.message', role='user', run_id=None, status=None, thread_id='thread_D3JUkq05bfvtmBw7QoNSuTy7')], object='list', first_id='msg_cRSYdkrscxnyHXimfqqivQZn', last_id='msg_SujuDWSAVzkKVx45SrhVnQQL', has_more=False)
下面打印最终的Assistant回应:
[TextContentBlock(text=Text(annotations=[], value="The top 5 most profitable flowers based on the total profit are listed below:\n1. **Rose** with a profit of \\$30,532.50\n2. **Tulip** with a profit of \\$25,037.00\n3. **Lily** with a profit of \\$15,823.00\n4. **Daisy** with a profit of \\$9,905.00\n5. **Sunflower** with a profit of \\$9,517.00\n\nThese results reveal which flower types are contributing most significantly to the business's bottom line. \n\nLet's move forward with the final task which involves forecasting the total revenue for the next 7 days using a Random Forest Regressor model. I will prepare the data and develop the model to perform this forecast."), type='text')]
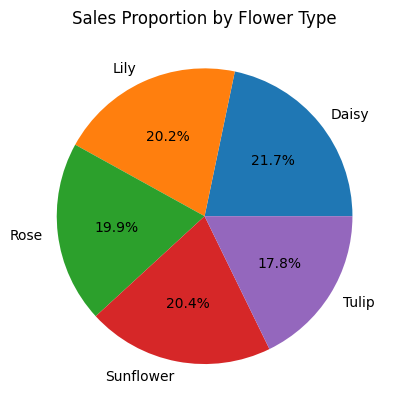
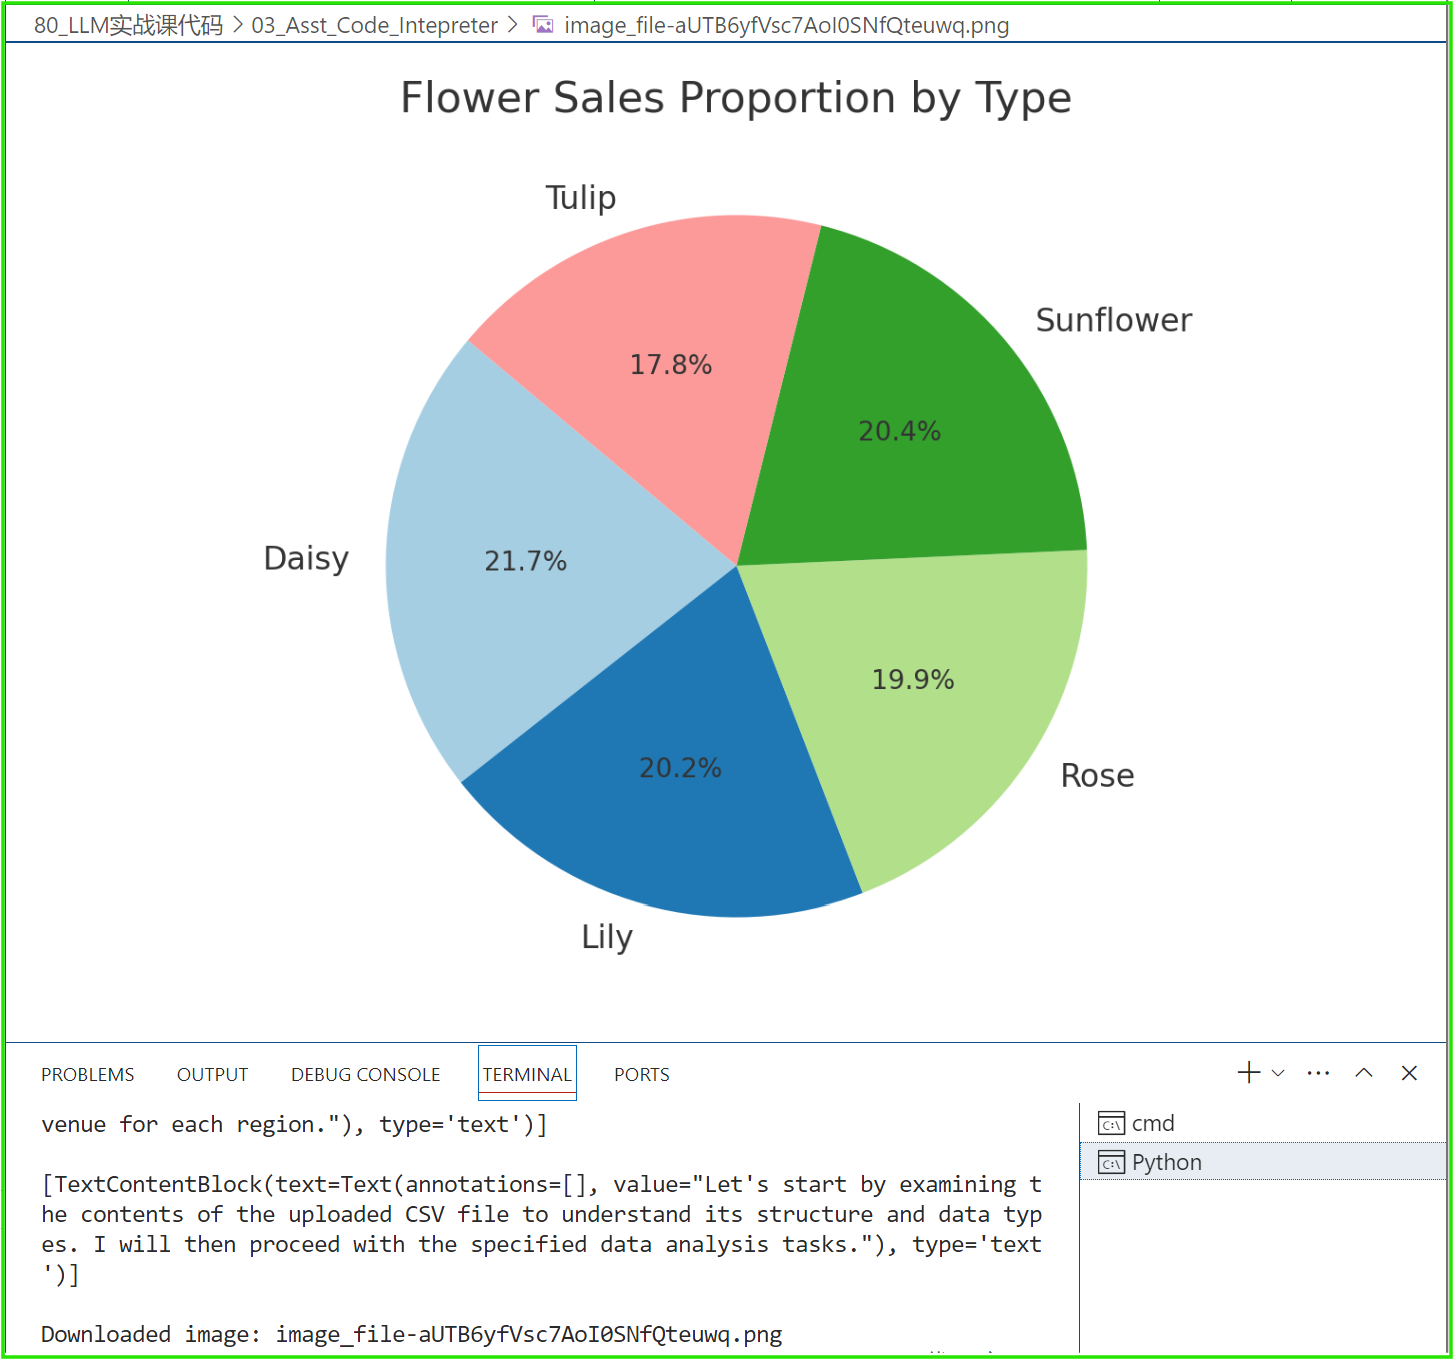
[ImageFileContentBlock(image_file=ImageFile(file_id='file-aUTB6yfVsc7AoI0SNfQteuwq'), type='image_file'), TextContentBlock(text=Text(annotations=[], value="The pie chart above presents the proportion of sales for each type of flower, indicating the relative popularity and market share of each flower type within the dataset.\n\nNext, we will proceed with task #4: identifying the top 5 most profitable flowers based on the total profit. I'll sum the profit for each flower type and display the top 5."), type='text')]
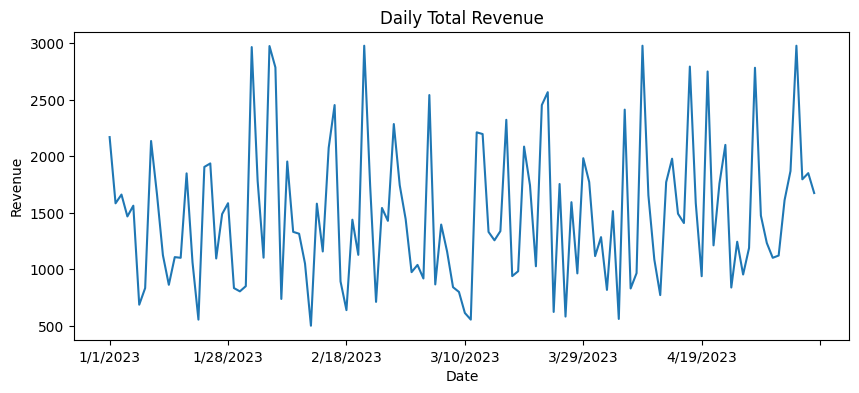
[ImageFileContentBlock(image_file=ImageFile(file_id='file-ARR9oWz1AdYwLCVeaDNsYfGk'), type='image_file'), TextContentBlock(text=Text(annotations=[], value='The line chart illustrates the daily total revenue from flower sales, showing various trends and fluctuations over time.\n\nMoving on to task #3, I will calculate the sales proportion of each flower type and visualize it using a pie chart.'), type='text')]
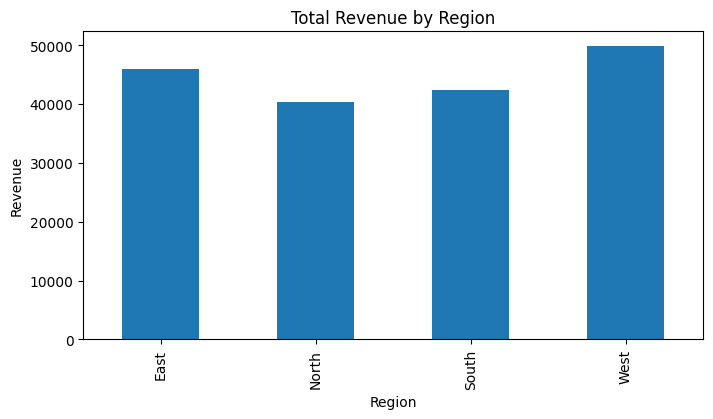
[ImageFileContentBlock(image_file=ImageFile(file_id='file-DA3uSxFhVE8KqZFrWKY2YWTX'), type='image_file'), TextContentBlock(text=Text(annotations=[], value="The bar chart above displays the total revenue from flower sales for each region.\n\nNext, let's address task #2 by grouping the data by date and calculating the daily total revenue, which we will then visualize as a line chart to observe trends over time."), type='text')]
[TextContentBlock(text=Text(annotations=[], value="The dataset contains the following columns:\n- `date`: The date of sales\n- `flower`: Type of flower sold\n- `count`: The number of flowers sold\n- `price`: Total price received for the flowers sold\n- `cost`: Total cost of the flowers sold\n- `profit`: Total profit from the flower sales\n- `region`: Geographic region of the sales\n\nFrom your requests, we'll proceed with the analysis tasks:\n1. Group the data by region and calculate the total revenue for each region.\n2. Group the data by date and calculate the daily total revenue.\n3. Calculate the sales proportion of each flower type.\n4. Find the top 5 most profitable flowers based on the total profit.\n\nLet's start with task #1 and visualize the total revenue for each region."), type='text')]
[TextContentBlock(text=Text(annotations=[], value="Let's start by examining the contents of the uploaded CSV file to understand its structure and data types. I will then proceed with the specified data analysis tasks."), type='text')]
|